

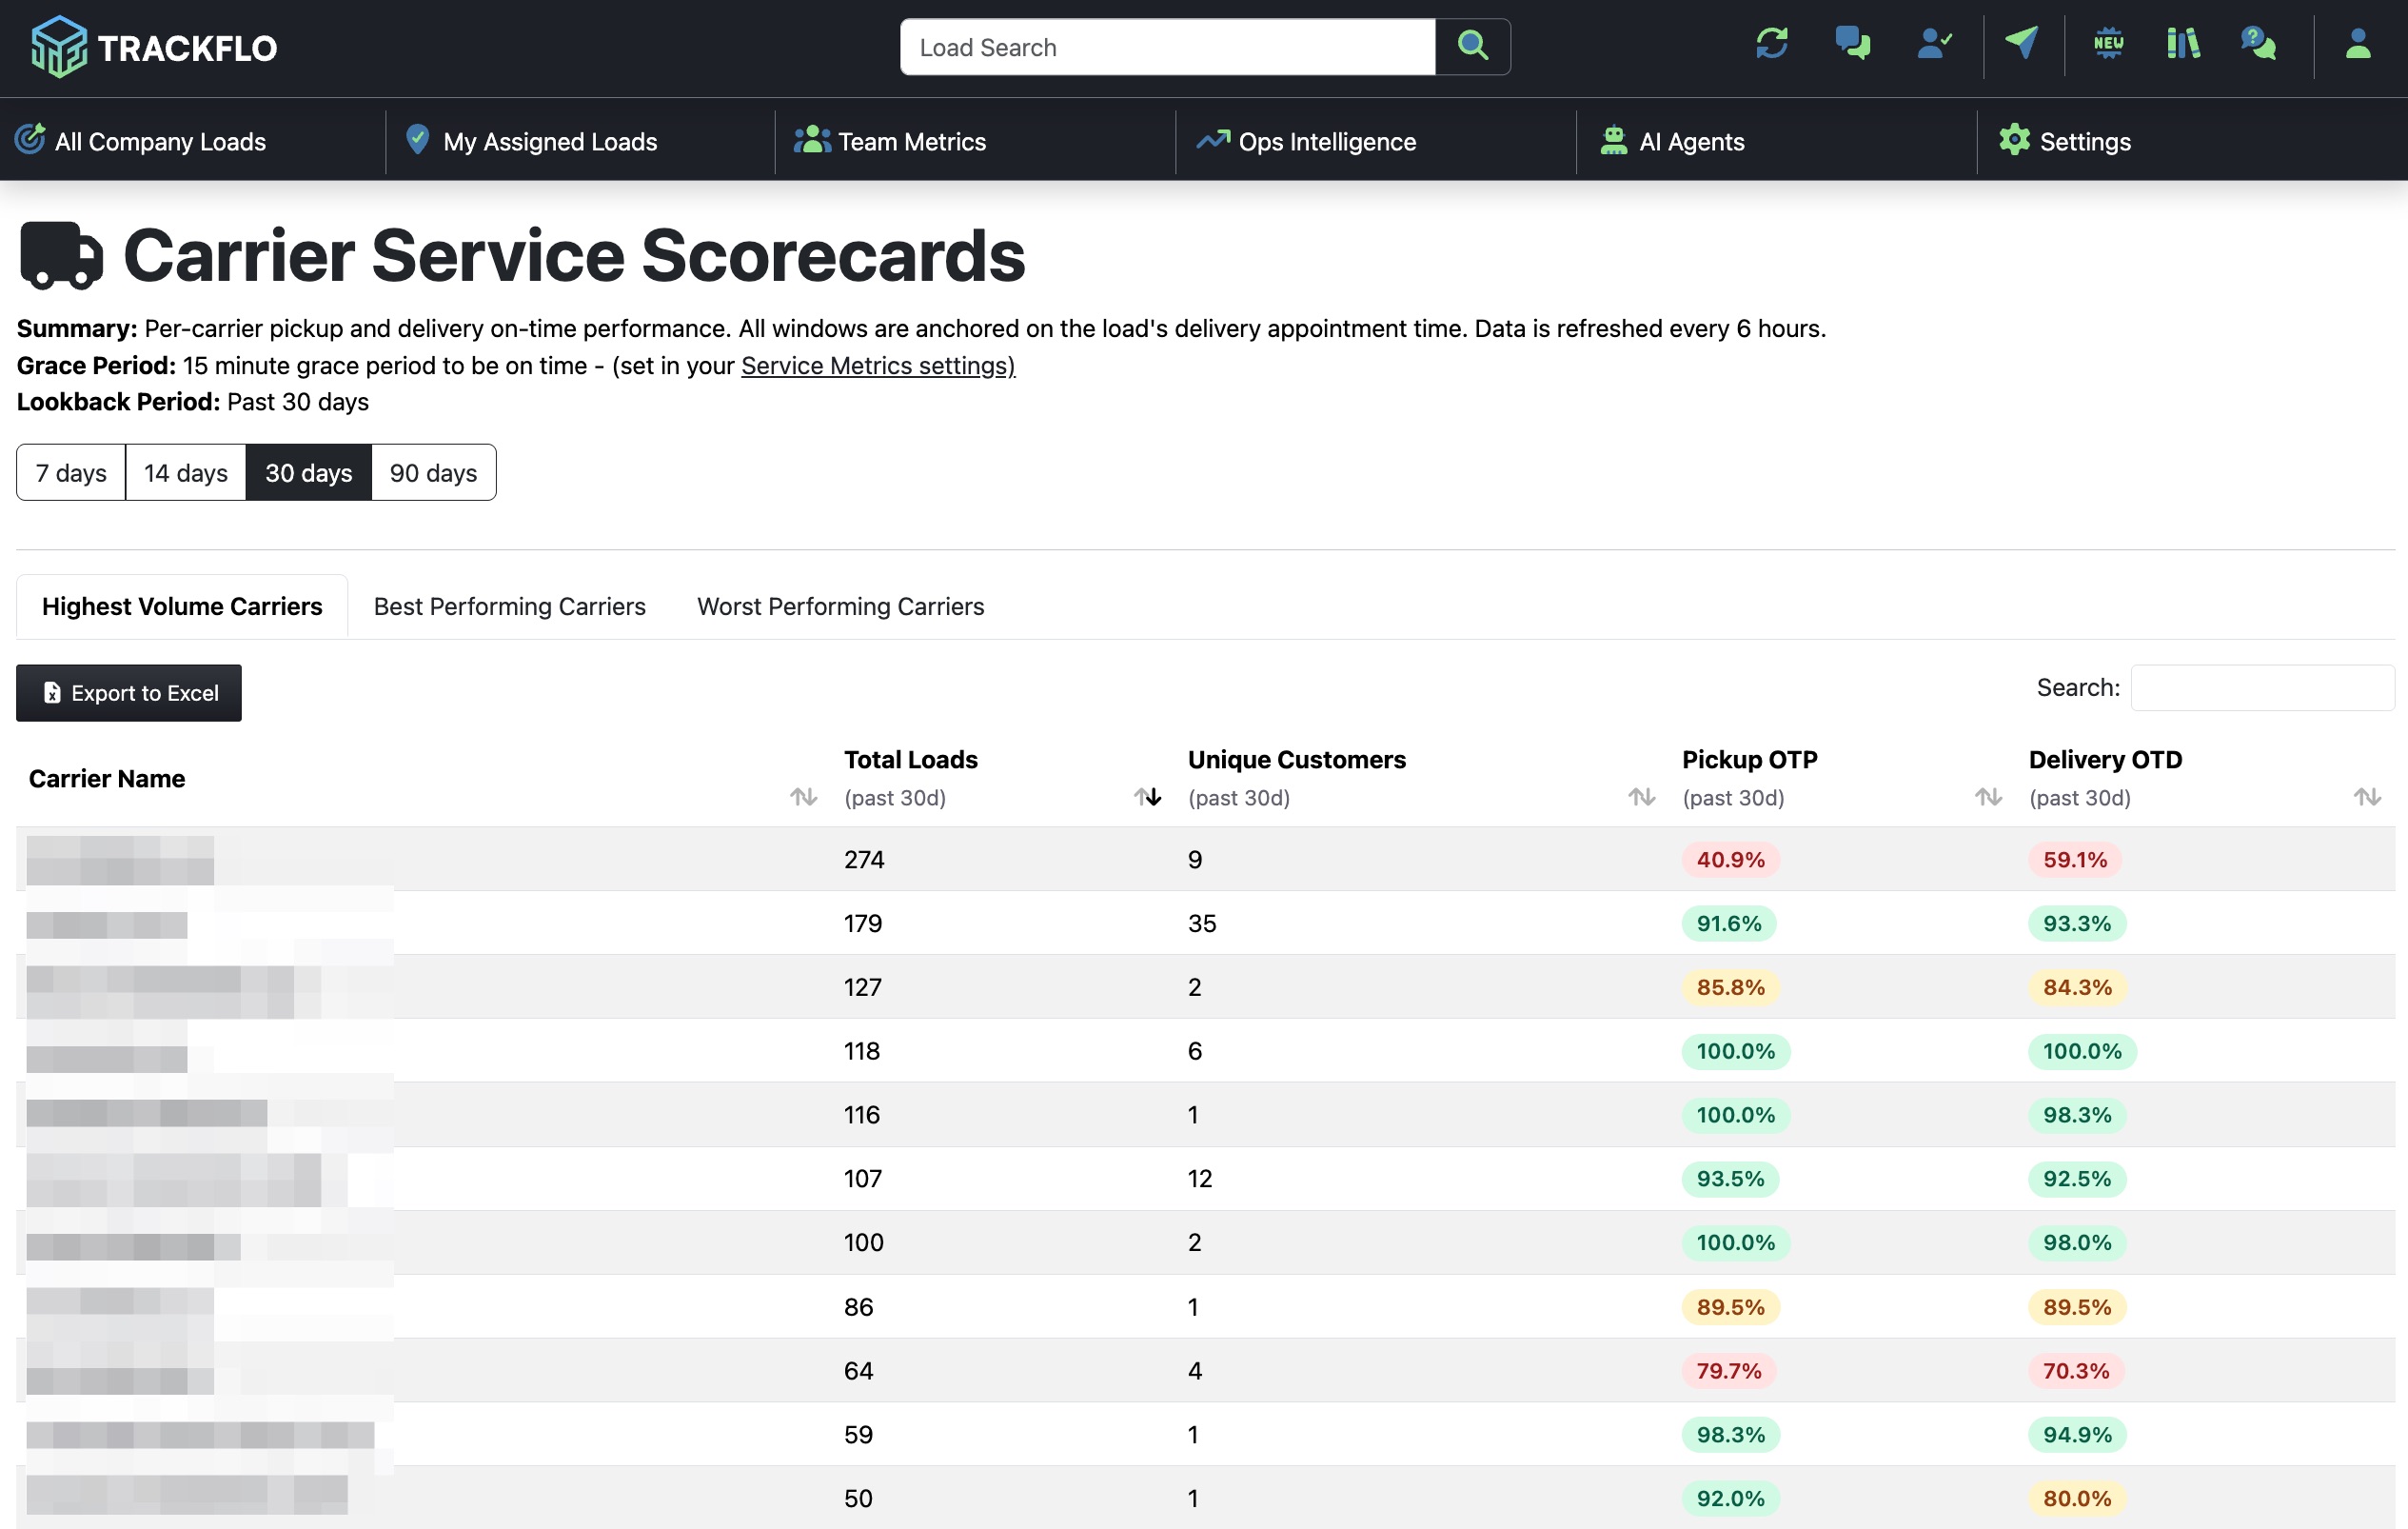
🚚 Carrier Service Scorecards
Score and rank your carriers on what actually matters: are they picking up and delivering on time?
Carrier Scorecards turn every load you've tracked into a clean, sortable view of carrier performance. Use it to negotiate harder, reward your best partners, and make data-backed decisions about who deserves more volume.
What It Is
Every carrier that's hauled freight for you in the lookback window, with their pickup OTP and delivery OTD broken out side-by-side. Three tabs make it easy to find the carriers you're looking for.
How to Read It
Lookback Period
Toggle between 7, 14, 30, or 90 days at the top. Use longer windows for procurement decisions, shorter windows for recent issue spotting. Data refreshes every 6 hours.
Tabs
Highest Volume Carriers — Your top carriers by load count. Start here for procurement reviews.
Best Performing Carriers — Carriers that are earning more of your freight.
Worst Performing Carriers — Carriers earning a hard conversation.
Columns
Column | What it means |
|---|---|
Carrier Name | The carrier hauling the loads |
Total Loads | Number of loads moved in the lookback window |
Unique Customers | How many of your customers this carrier ran freight for |
Pickup OTP | % of loads picked up on time (within grace period) |
Delivery OTD | % of loads delivered on time (within grace period) |
Color Coding
🟢 Green = Performing well · 🟡 Yellow = Watch list · 🔴 Red = Performance problem
Common Use Cases
Carrier Negotiations — Heading into rate discussions? Open the carrier on a 90-day lookback and bring receipts. Hard numbers turn "you've been late" into "you've been late on 14 of your last 64 loads."
Reward Top Performers — Best Performing Carriers → these are the partners worth more freight, faster pay, or first call on premium lanes.
Cleaning Up the Carrier Base — Worst Performing Carriers → identify the carriers consistently underperforming and decide who to keep, retrain, or remove.
Customer-Specific Carrier Review — Sort by Unique Customers to see which carriers are running freight broadly across your book — those carriers' performance affects multiple QBRs at once.
Tips & Best Practices
Filter low-volume carriers out mentally. A carrier with 2 loads at 50% OTP isn't a trend — they had a bad day. Look for carriers with enough volume to draw real conclusions.
Compare windows. A carrier's 7-day vs 90-day OTP tells you whether things are getting better or worse.
Export to Excel for procurement meetings, vendor reviews, or carrier scorecard emails.
Use the search bar to pull up a specific carrier fast.
Pair with the customer deep-dive. When a carrier looks bad, click into the affected customers to see which lanes are the problem — it's usually not all of them.
FAQs
How is "on time" calculated? All windows are anchored to the load's appointment time, with a grace period applied (default 15 minutes, configurable in Service Metrics settings). A carrier's number looks off — what could cause that? Two common culprits: very low load volume in the window, or stale tracking data on a few loads inflating the late count. Click into a customer's deep-dive to spot-check. Can I see which customers a carrier is running for? Yes — open any Customer Deep-Dive and check the Carrier Performance tab to see how a carrier is doing for that specific customer. Why is the Unique Customers count higher than I expected? We count every customer the carrier moved any volume for in the window — including one-load relationships. How often does data refresh? Every 6 hours.