

📈 Ops Intelligence: Overview
Ops Intelligence is a suite of dashboards that takes the tracking data you're already collecting in TrackFlo and turns it into customer-grade scorecards and detention recovery tools. It's available to all admins under the Ops Intelligence tab.
What's Inside
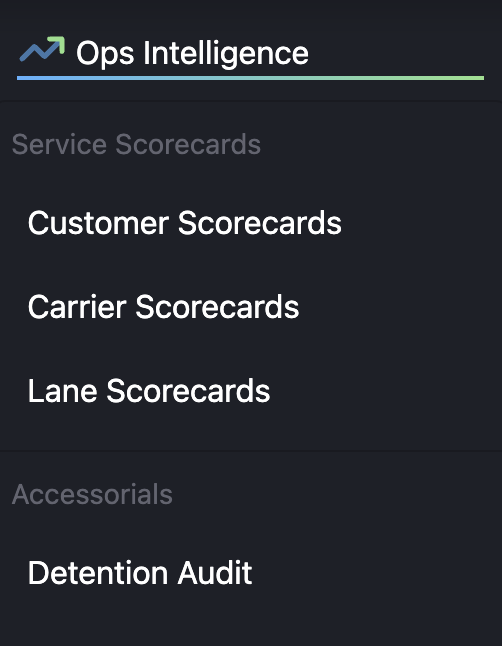
Ops Intelligence is organized into two sections:
Service Scorecards
Per-customer, per-carrier, and per-lane pickup and delivery on-time performance — with views for your highest-volume, best-performing, and worst-performing accounts.
Customer Scorecards — How is each of your customers' freight performing?
Carrier Scorecards — Which carriers are actually delivering on their promises?
Lane Scorecards — Where is your network strong, and where is it leaking service? Click into any customer from the Customer Scorecards page to access a Customer Deep-Dive with carrier performance, lane performance, facility dwell, and every late or detention-eligible load.
Accessorials
Detention Audit — A dollar-and-cents view of every load that qualifies for detention, plus the estimated payout you could be capturing.
How to Read the Data
A few concepts apply across every page:
Pickup OTP — On-Time Pickup. The percentage of loads picked up within your grace period.
Delivery OTD — On-Time Delivery. The percentage of loads delivered within your grace period.
Grace Period — A buffer (default 15 minutes) for what counts as "on time." Configurable in Service Metrics settings.
Detention Threshold — How long a driver has to dwell before detention starts. Default is 2 hours. Also configurable in Service Metrics settings.
Lookback Period — Most pages let you slice by 7, 14, 30, or 90 days. Detention Audit also offers 1 and 2 day views.
Color coding — Green = healthy, yellow = watch, red = action needed. Quick visual triage.
Common Workflows
Preparing for a QBR Start with Customer Scorecards → click into the customer → review their Customer Deep-Dive tabs to walk through OTP/OTD, problem carriers, problem lanes, and dwell trends.
Negotiating with carriers Open Carrier Scorecards → switch to "Worst Performing Carriers" → use the data to back up rate conversations or rebid decisions.
Winning more lane volume Open Lane Scorecards → switch to "Best Performing Lanes" → bring those numbers to your sales team or directly to customers as proof of where you can scale.
Recovering detention dollars Open Detention Audit → review the Customer Detention and Facility Detention tabs → identify the biggest exposure and start the recovery conversation.
Tips & Best Practices
Set your thresholds first. Visit Service Metrics settings to dial in your grace period and detention threshold before sharing reports with your team.
Use the lookback selectors deliberately. A 7-day view shows trends; a 90-day view shows patterns. Both have their place.
Export to Excel for any scorecard you want to share offline or pivot in your own tools.
Click in. The scorecard pages are summaries — the Customer Deep-Dive is where the root cause lives.
FAQs
Who has access? All admin users have full access to Ops Intelligence.
How fresh is the data? Data refreshes every 6 hours.
How are pickup and delivery times measured? All windows are anchored on the load's appointment time, with your configured grace period applied.
Can I change what counts as "on time"? Yes — adjust the grace period in Service Metrics settings.
Can I change what counts as detention? Yes — adjust the detention threshold in Service Metrics settings.
Where to Go Next
Customer Scorecards — Score and rank your customers
Carrier Scorecards — Score and rank your carriers
Lane Scorecards — Score and rank your lanes
Customer Deep-Dive — Drill into a single customer
Detention Audit — Recover detention dollars