

💯 Customer Service Scorecards
Customer Scorecards
Per-customer pickup and delivery on-time performance — plus a deep-dive into every angle of a single customer's service story.
Customer Scorecards show you, at a glance, how your freight is performing for each of your customers. From there, click into any customer for a full breakdown by carrier, lane, facility, and individual load. It's the single best place to prep for a QBR, troubleshoot a slipping account, or build the case for where to grow.
What It Is
Two views in one workflow:
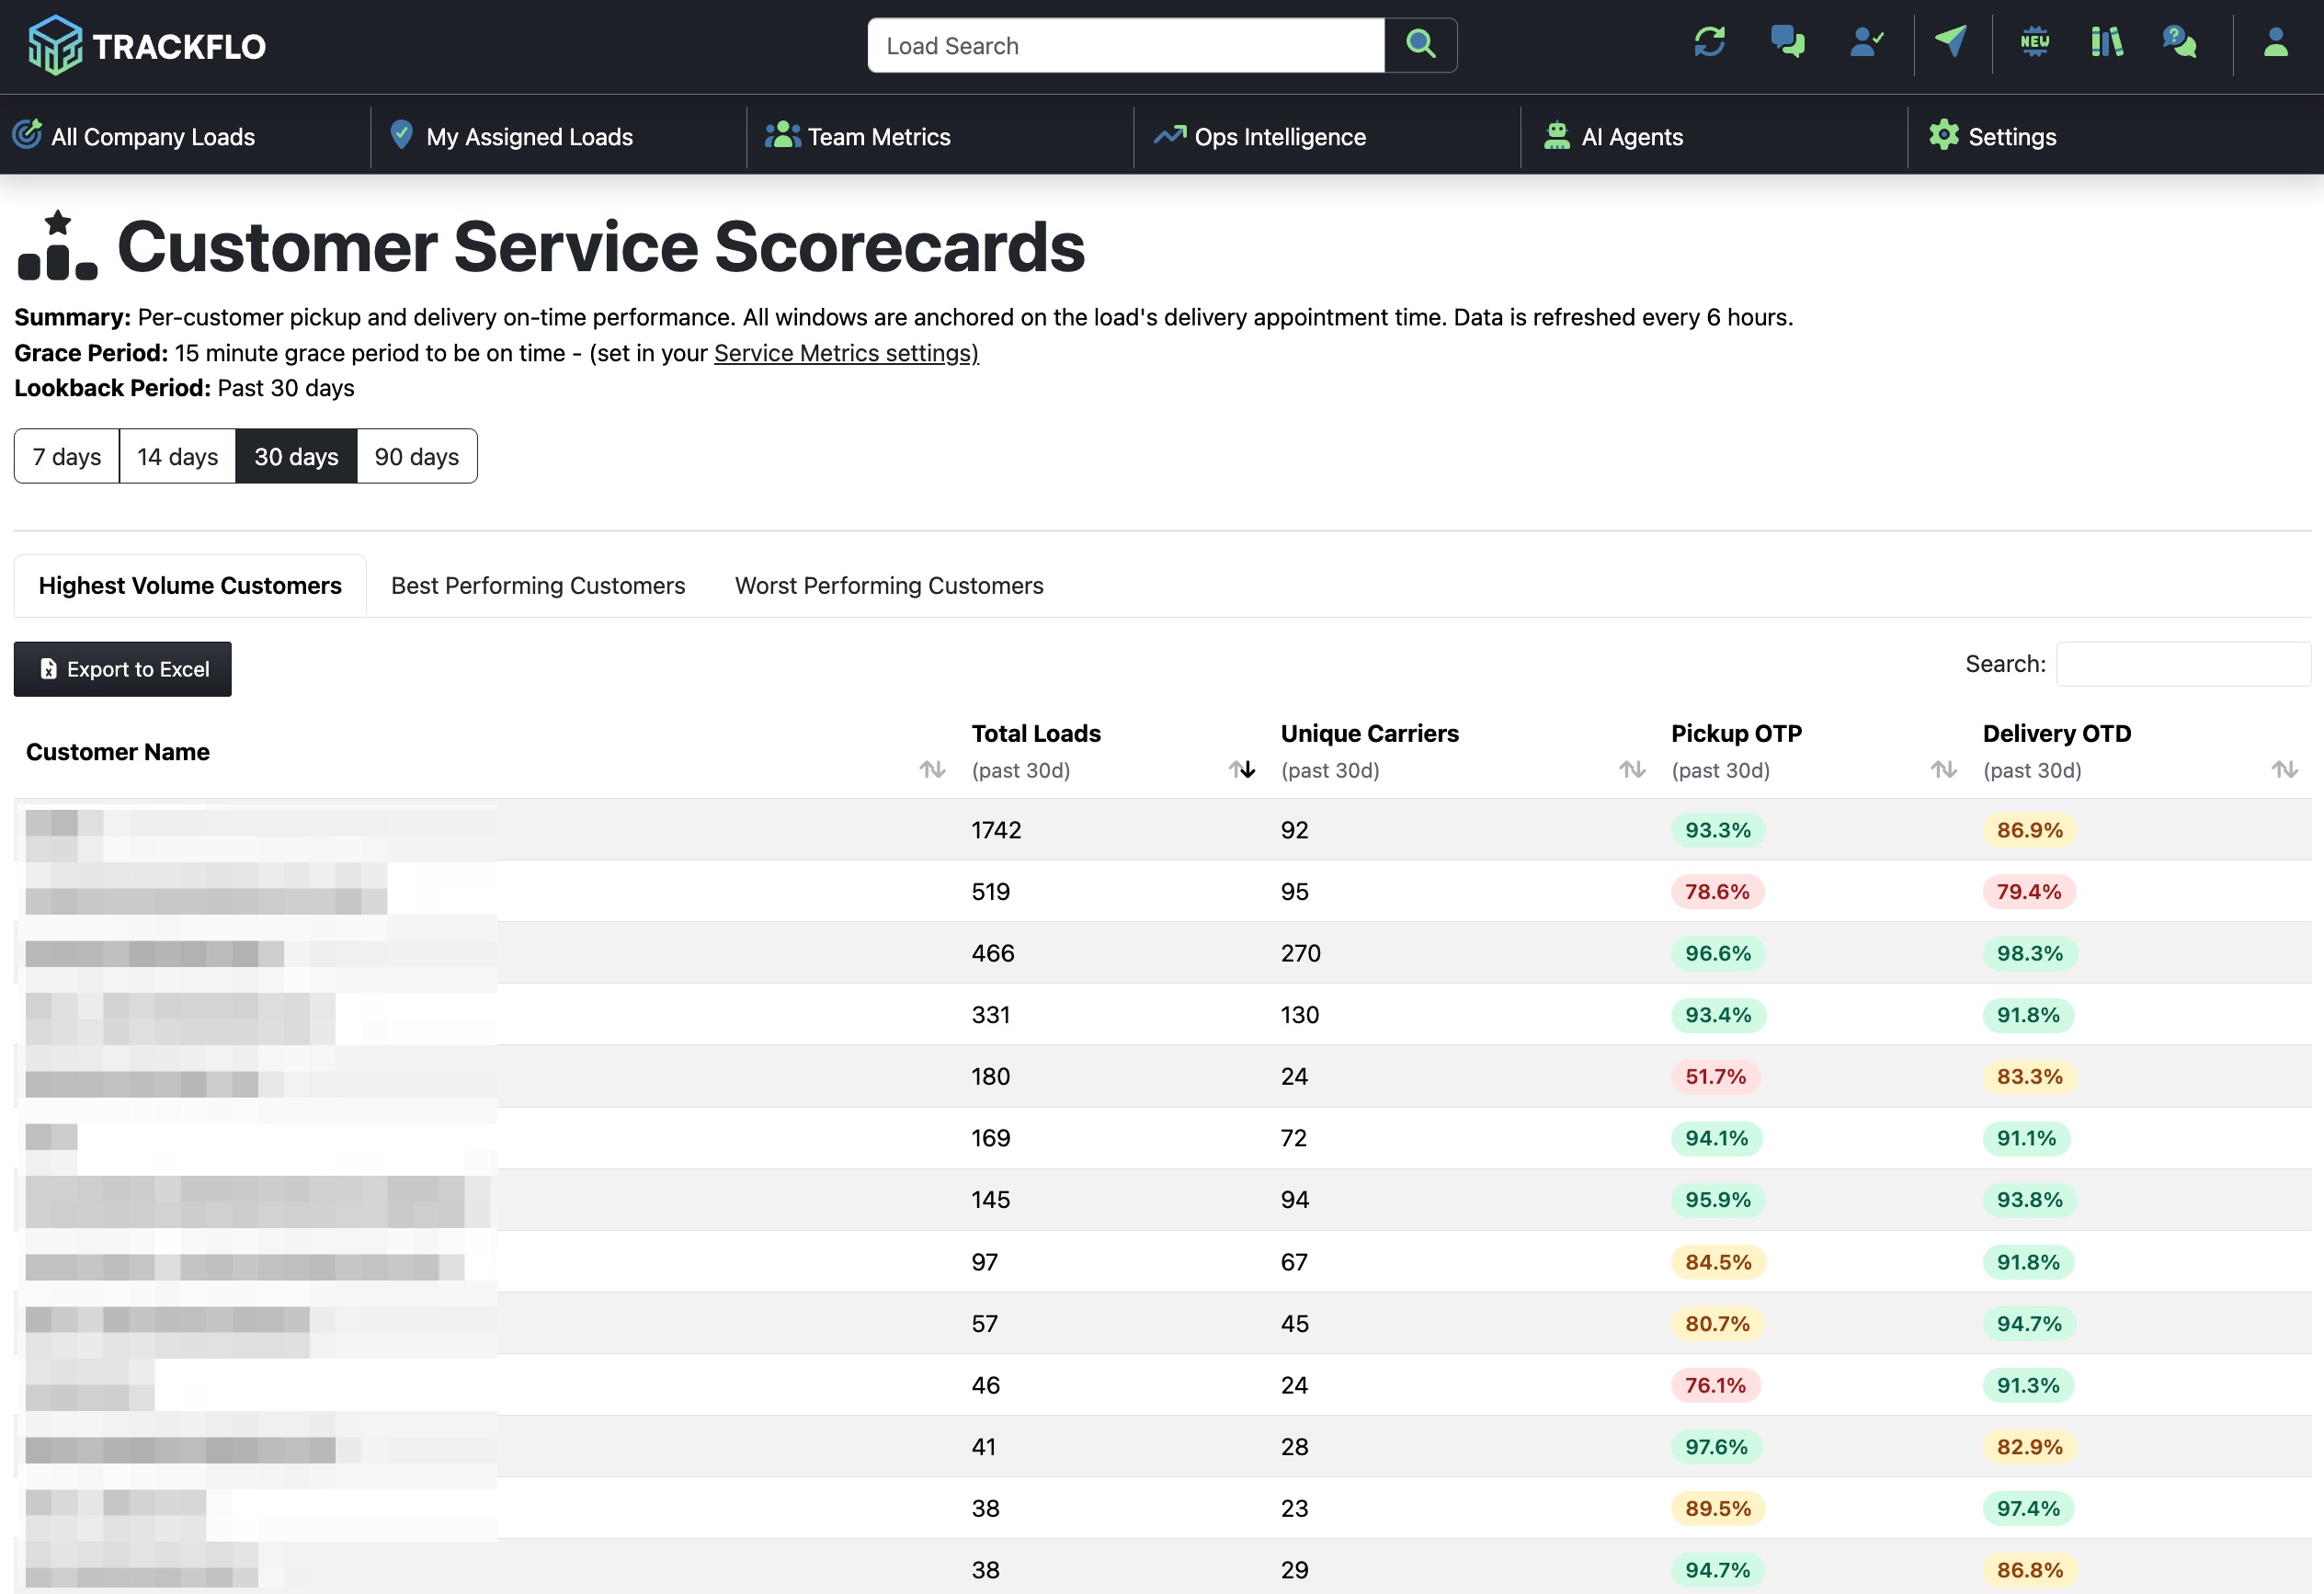
The Scorecards page — Every customer in your book, ranked by volume or performance.
The Customer Deep-Dive — Click any customer to drill into their full service story across eight tabs.
How to Read the Scorecards Page
Lookback Period
Toggle between 7, 14, 30, or 90 days at the top. Shorter windows show recent trends; longer windows show patterns. Data refreshes every 6 hours.
Tabs
Highest Volume Customers — Your biggest accounts by total loads. Start here for QBR prep.
Best Performing Customers — Where you're crushing it. Great for testimonials, case studies, or upsell conversations.
Worst Performing Customers — Where service is slipping. Start here when you need to triage.
Columns
Column | What it means |
|---|---|
Customer Name | The customer the loads belong to |
Total Loads | Number of loads moved in the lookback window |
Unique Carriers | How many different carriers handled this customer's freight |
Pickup OTP | % of loads picked up on time (within grace period) |
Delivery OTD | % of loads delivered on time (within grace period) |
Color Coding
🟢 Green = Healthy · 🟡 Yellow = Watch zone · 🔴 Red = Action needed
The Customer Deep-Dive
Click any customer row on the scorecards page to open their deep-dive. Eight tabs, each answering a different question about how that customer's freight is performing.
[Screenshot: Customer Service Scorecard drill-in page]
1. Customer Service Scorecard
The customer's headline numbers — Pickup OTP and Delivery OTD across all their freight in the window. Start here.
2. Carrier Performance
Every carrier running freight for this customer, with their individual OTP and OTD for this customer's loads only.
Column | What it means |
|---|---|
Carrier Name | The carrier |
Total Loads | Loads run for this customer in the window |
On Time Pickup | % picked up on time |
Total Late Pickups | Count of late pickups |
On Time Delivery | % delivered on time |
Total Late Deliveries | Count of late deliveries |
Use this to identify which carriers are dragging down a customer's experience.
3. Lane Performance
Every lane this customer ships with you, broken out by OTP/OTD. Use this to spot which lanes are reliable and which are causing pain.
4. Lane Carrier Performance
The crossroad of lane and carrier. If a carrier looks great overall but bad on one lane, this tab will show you.
5. Facility Dwell
Average dwell time at every pickup and delivery facility for this customer.
Column | What it means |
|---|---|
Facility Name | Where the load stopped |
City / State | Location |
Stop Type | Pickup or Delivery |
Total Stops | Stops in the window |
Average Dwell Time | Average minutes on-site |
Total Detention Loads | Loads that hit the detention threshold |
Detention Ratio (%) | % of stops that became detention-eligible |
Critical for diagnosing whether late deliveries are caused by carriers or by the customer's own facilities.
6. All Late Pickup Loads
Every individual late pickup in the window. Use it to audit specific loads or build a list for a customer conversation.
7. All Late Delivery Loads
Every individual late delivery in the window. Same use as above.
8. All Detention Eligible Loads
Every load that crossed the detention threshold. Cross-reference with the Detention Audit when you're ready to recover dollars.
Common Workflows
QBR Prep (the full sweep)
Set lookback to 30 or 90 days.
Take a screenshot of the Customer Service Scorecard for the deck.
Note the worst-performing carrier (Carrier Performance tab).
Note the worst-performing lane (Lane Performance tab).
Identify the biggest dwell offenders (Facility Dwell tab).
Have a list of late loads ready in case the customer asks for examples.
Catching Drop-Off Early Compare a customer's 7-day view to their 30-day view on the scorecards page. If recent numbers are notably worse than the longer-term average, it's an early-warning signal — get ahead of the conversation.
Customer Just Complained About Service
Open the customer's deep-dive at a 7-day lookback.
Open All Late Pickup Loads and All Late Delivery Loads.
Cross-reference with Carrier Performance — is one carrier responsible?
Check Facility Dwell — are the customer's own facilities the bottleneck?
Building a Detention Recovery Case
Open the customer's All Detention Eligible Loads tab.
Cross-reference with Facility Dwell — are specific facilities driving the detention?
Use the Detention Audit page for the dollar estimate.
Identifying Account Growth Candidates Best Performing Customers → those crushing it on service are your strongest candidates for additional volume or a renewed contract.
Tips & Best Practices
Bookmark the Worst Performers tab before weekly account reviews — fastest way to surface problems.
Always start with the Customer Service Scorecard tab in the deep-dive. It's the headline; the other tabs are the supporting evidence.
The Lane Carrier Performance tab is gold for QBRs. It pinpoints exactly where the breakdown is happening.
Don't skip Facility Dwell. Customers often blame carriers for what's actually a receiving issue at their own DC.
Export to Excel when you need to share with a customer or build a presentation. Each tab can be exported individually.
Use the search bars in tables to jump straight to a specific customer, carrier, lane, or facility.
Calibrate your grace period. If everyone's in the red, your grace period might be too tight. Adjust in Service Metrics settings.
FAQs
How is "on time" calculated? All windows are anchored to the load's appointment time, with a grace period (default 15 minutes) applied. Configurable in Service Metrics settings. Why don't I see a customer I expected? They need at least one tracked load in the lookback window. Try widening to 90 days. The deep-dive numbers look different from the scorecards page. Why? They shouldn't — double-check the lookback window matches on both views. A carrier shows in the deep-dive but isn't on the main Carrier Scorecards page. Why? The deep-dive shows every carrier that ran any load for this customer, including very low-volume ones. Try the search bar on the Carrier Scorecards page. Why is dwell time so important? Dwell is the leading indicator for both detention and late deliveries. A facility with high dwell drives late deliveries downstream — and you might be able to bill detention for it. Can non-admins see this page? Currently Ops Intelligence is admin-only. How often does data refresh? Every 6 hours.