

🛣️ Lane Service Scorecards
See which lanes you're crushing, which lanes are leaking service, and where there's room to grow.
Lane Scorecards roll up your performance lane-by-lane across every customer and carrier. Use it to find your most reliable lanes (and pitch more of them), spot lanes that are quietly hurting service, and bring data to your sales team.
What It Is
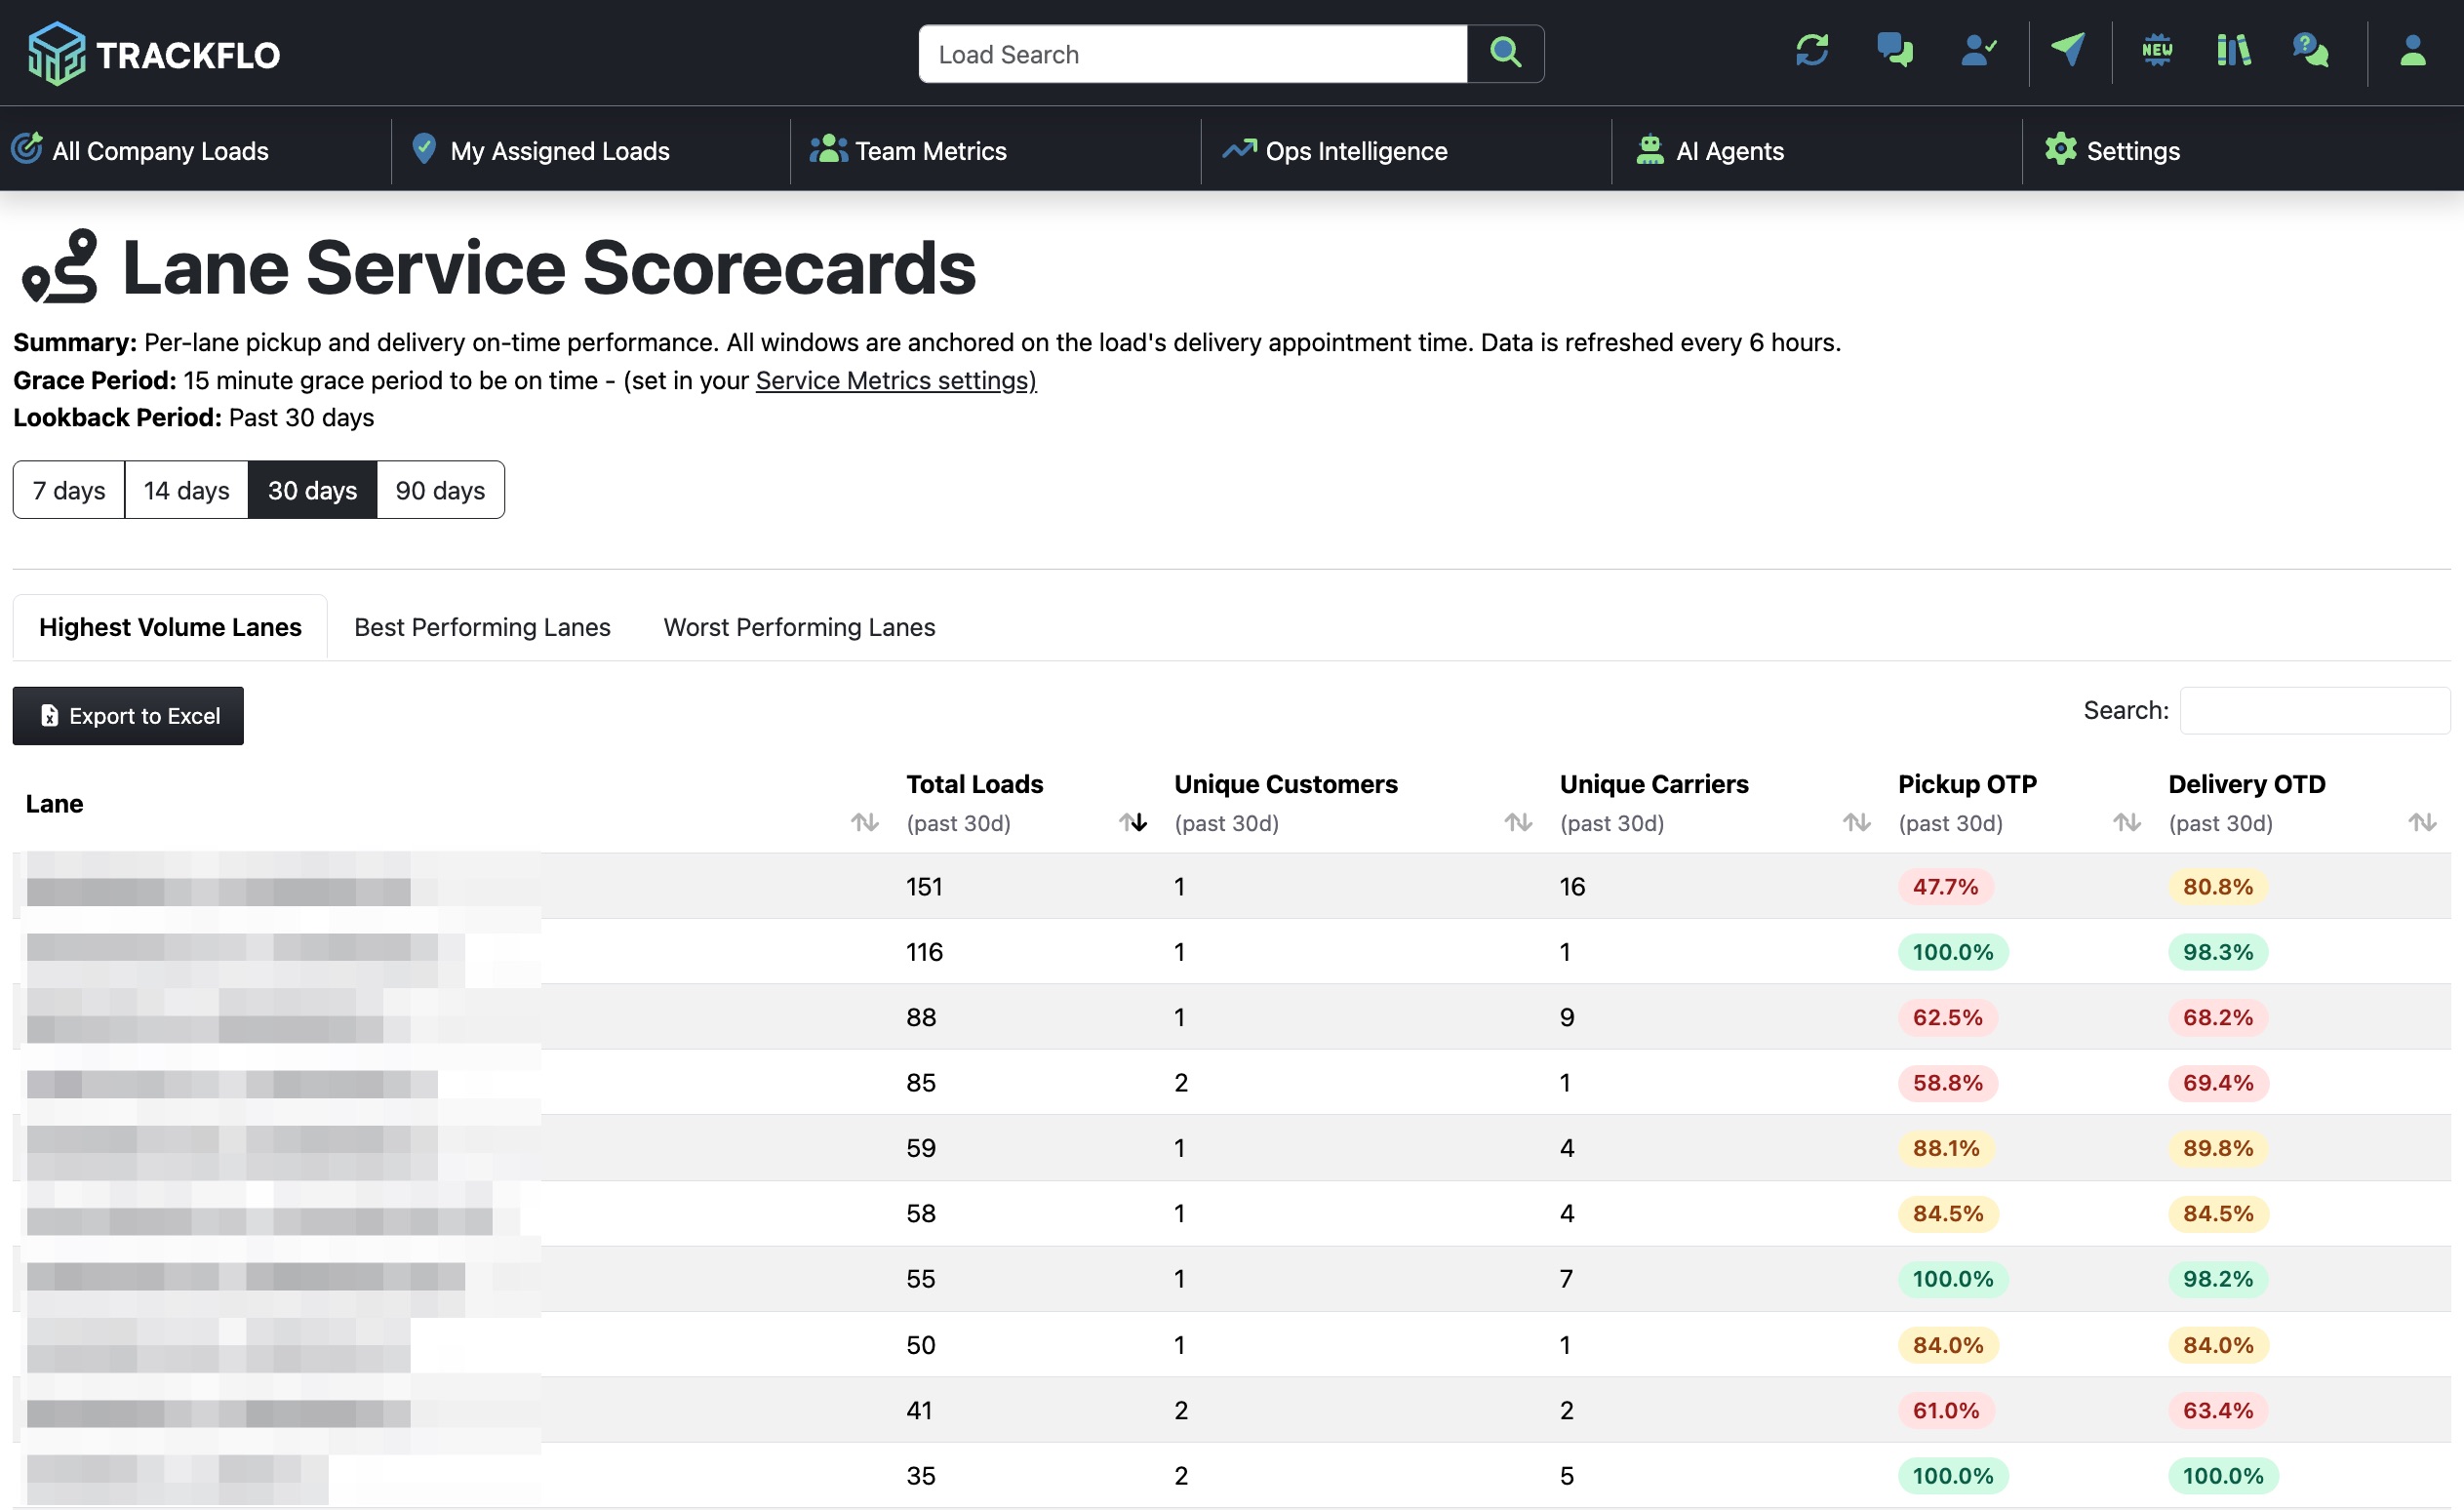
Every lane you've moved freight on in the lookback window appears here, with pickup OTP and delivery OTD aggregated across all customers and carriers running that lane. Three tabs let you sort by volume or by performance.
How to Read It
Lookback Period
Toggle between 7, 14, 30, or 90 days at the top. Lane performance benefits from longer windows — try 30 or 90 days to get statistically meaningful results. Data refreshes every 6 hours.
Tabs
Highest Volume Lanes — Your busiest lanes, regardless of performance.
Best Performing Lanes — Where service is rock solid. Pitch these for growth.
Worst Performing Lanes — Where service is breaking down. Investigate before they cost you a customer.
Columns
Column | What it means |
|---|---|
Lane | Origin → Destination pair |
Total Loads | Number of loads on this lane in the lookback window |
Unique Customers | How many customers ship this lane with you |
Unique Carriers | How many carriers run this lane for you |
Pickup OTP | % of loads picked up on time |
Delivery OTD | % of loads delivered on time |
Color Coding
🟢 Green = Reliable lane · 🟡 Yellow = Mixed performance · 🔴 Red = Problem lane
Common Use Cases
Sales Conversations — Best Performing Lanes → bring this list to your sales team. "We run this lane at 98% on-time over the last 90 days" is a strong pitch.
Customer Growth Pitches — When a customer ships in a lane you're already strong on, that's an upsell waiting to happen. Sort Best Performing Lanes by volume and look for matches.
Diagnosing Lane Problems — Worst Performing Lanes → if a single carrier is running most of the volume, the problem is likely the carrier. If multiple carriers are underperforming on the same lane, the problem is likely the lane (e.g., a tight facility, a tough route).
Network Planning — Identify lanes with high volume across many customers but few carriers — those are concentration risk lanes worth diversifying.
Tips & Best Practices
Mind the lane volume. A lane with 3 loads at 33% OTP isn't a trend. Filter your eye toward lanes with enough volume to be meaningful.
Use Best Performing Lanes for marketing. These are the lanes where you can confidently say "we deliver." Use them in case studies, sales decks, and customer review meetings.
Cross-reference with carriers. A lane in the red might just be one carrier dragging the average down. Check the Customer Deep-Dive's Lane Carrier Performance tab to see.
Export to Excel when sharing lane analysis with sales or planning teams.
Use the search bar to find a specific origin or destination quickly.
FAQs
How is "on time" calculated? All windows are anchored to the load's appointment time, with a grace period applied (default 15 minutes, configurable in Service Metrics settings). How is a "lane" defined? By origin city/state to destination city/state for the loads in the window. Why do some lanes have low volume? We show every lane that had at least one tracked load in the window. Use the Total Loads column to focus on lanes with enough volume to draw conclusions from. A lane has poor performance but the carriers all look fine on their own scorecard. Why? This usually means the issue is lane-specific — facility delays at the origin or destination, traffic patterns, or appointment availability. Check the Facility Dwell tab in any affected Customer Deep-Dive. How often does data refresh? Every 6 hours.